Multiple Networks & Animation
Welcome to the last tutorial of PhosNetVis! this tutorial, we will learn how to visualize multiple networks and create an animation of the networks using the PhosNetVis tool. We will use six provided datasets curated from SARS-CoV-2 phosphorylations to create the networks and visualize them. Let’s get started!
Step #1
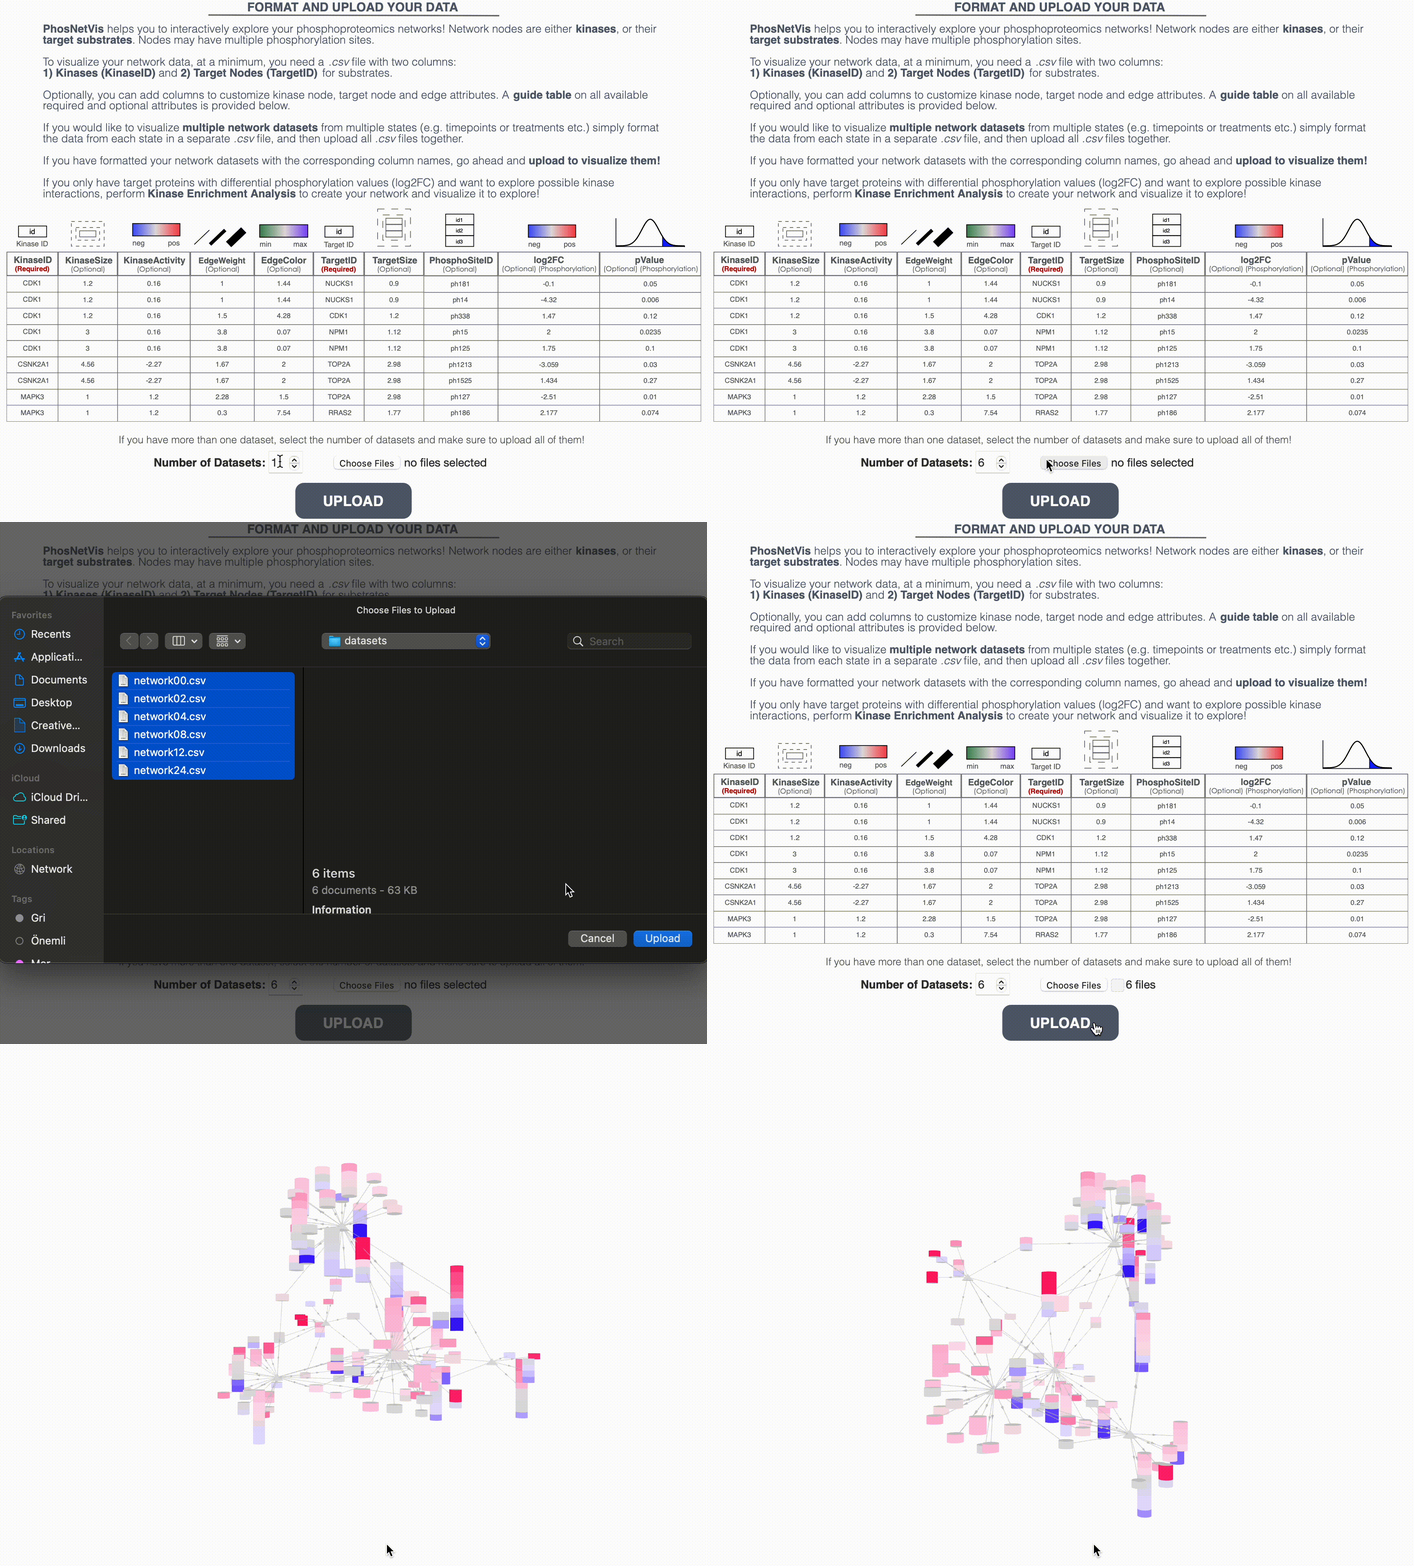
Download Sample Datasets: The first step is to download a dataset that is in the correct format file for analysis. You can use the example file provided by clicking on the “Download Sample Data” link below.
Step #2
Upload and visualize the datasets: Once you have downloaded the sample datasets, go to the PhosNetVis website and navigate to the “Visualization” page, and upload 6 datasets. Make sure Number of Datasets parameter is 6 in the visualization page.

Step #3
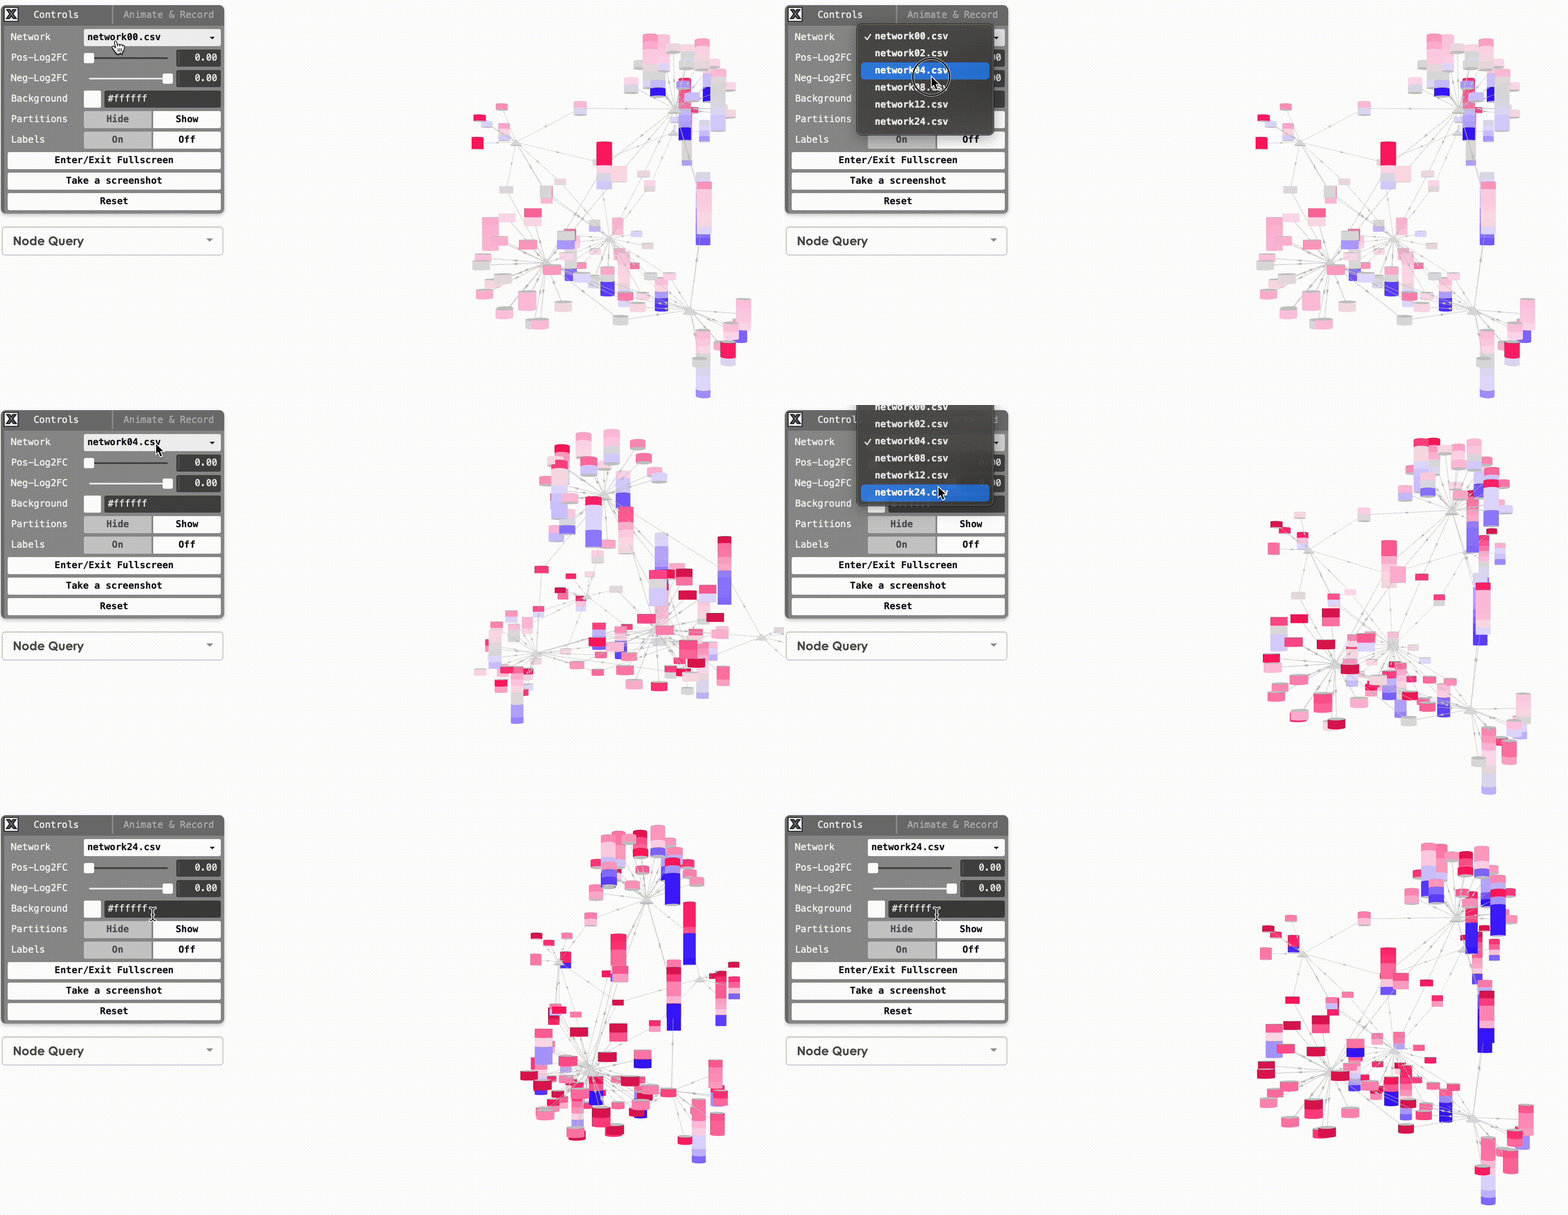
Change networks to visualize: Once the networks are created, you can select which one to visualize. On the left-hand side of the visualization page, you will see a list of the networks. Simply select the network you want to visualize.

Step #4
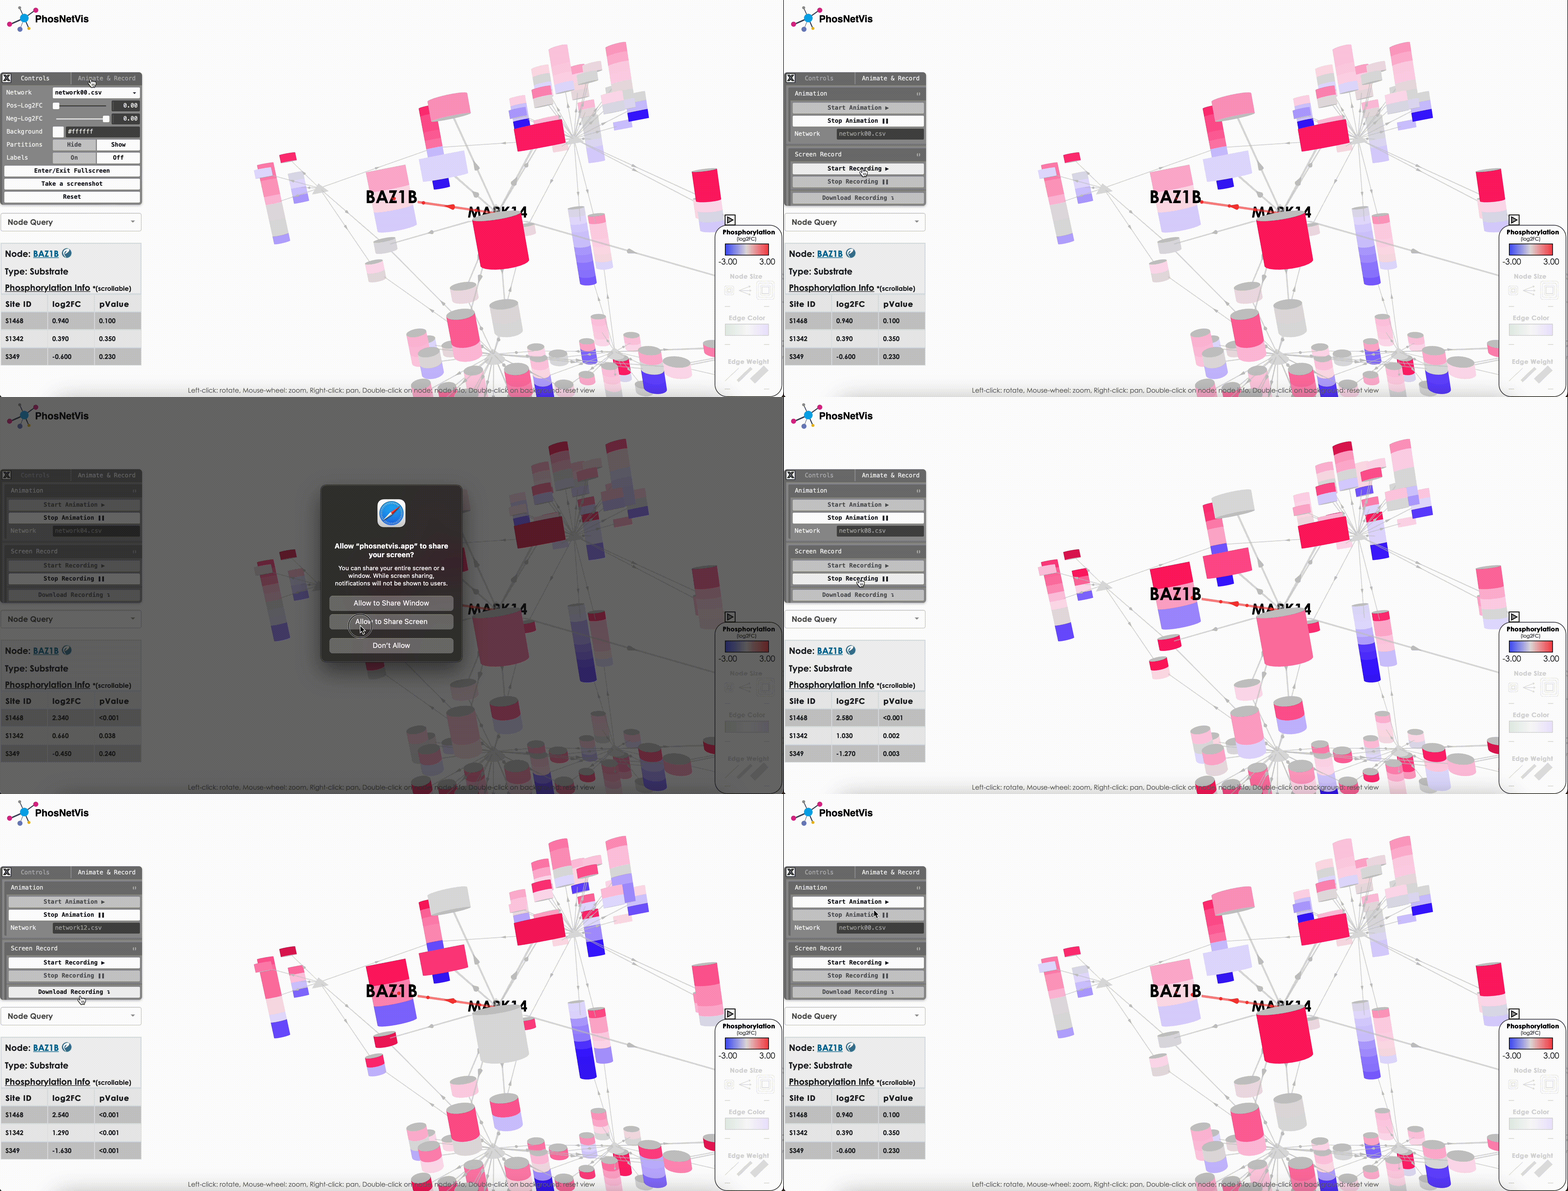
Animate and Record: To create an animation, switch to the “Animate & Record” tab. You can simply click “Start Animation” to switch through all networks you have uploaded. You can also select a node and observe its phosphorylation changes in different networks, and save the animation by clicking “Start Recording”.

Important Note:In order to create an animation, you need to have at least 2 networks and these networks must have the exact same nodes!
Final Words
That’s it! With this tutorial, you should now be able to create and visualize multiple networks and create an animation of those networks using the PhosNetVis tool. This was the final tutorial, feel free to reach us by filling the “Contact Us” form if you have any questions or suggestions! ➡️ Contact Us